
Expert-supervised comparison
Reported average energy advantage of coated strings over untreated comparison strings.
05 / FIELD RESULTS
What matters is performance in everyday operation: on real solar installations, in real weather, over time.
BEYOND THE LABORATORY
Laboratory tests explain mechanisms. Field comparisons show performance under rain, dust, organic deposits and actual operating conditions. Both are useful; practical results are central to our project discussions.
REPORTED PROJECT RESULTS
Reported average energy advantage of coated strings over untreated comparison strings.
Reported production comparison between two systems, one coated and one uncoated.
Maximum reported increase for an individual string after 3 months; not the average for the entire installation.
These figures come from the supplied project summaries. Different sites and test methods are not directly comparable, and no percentage is a guaranteed result for a new installation.
PROJECT GALLERY
Open each sheet to read the original evidence at full size. The supplied sheets are in English or English/German; the summaries below are available in all website languages.
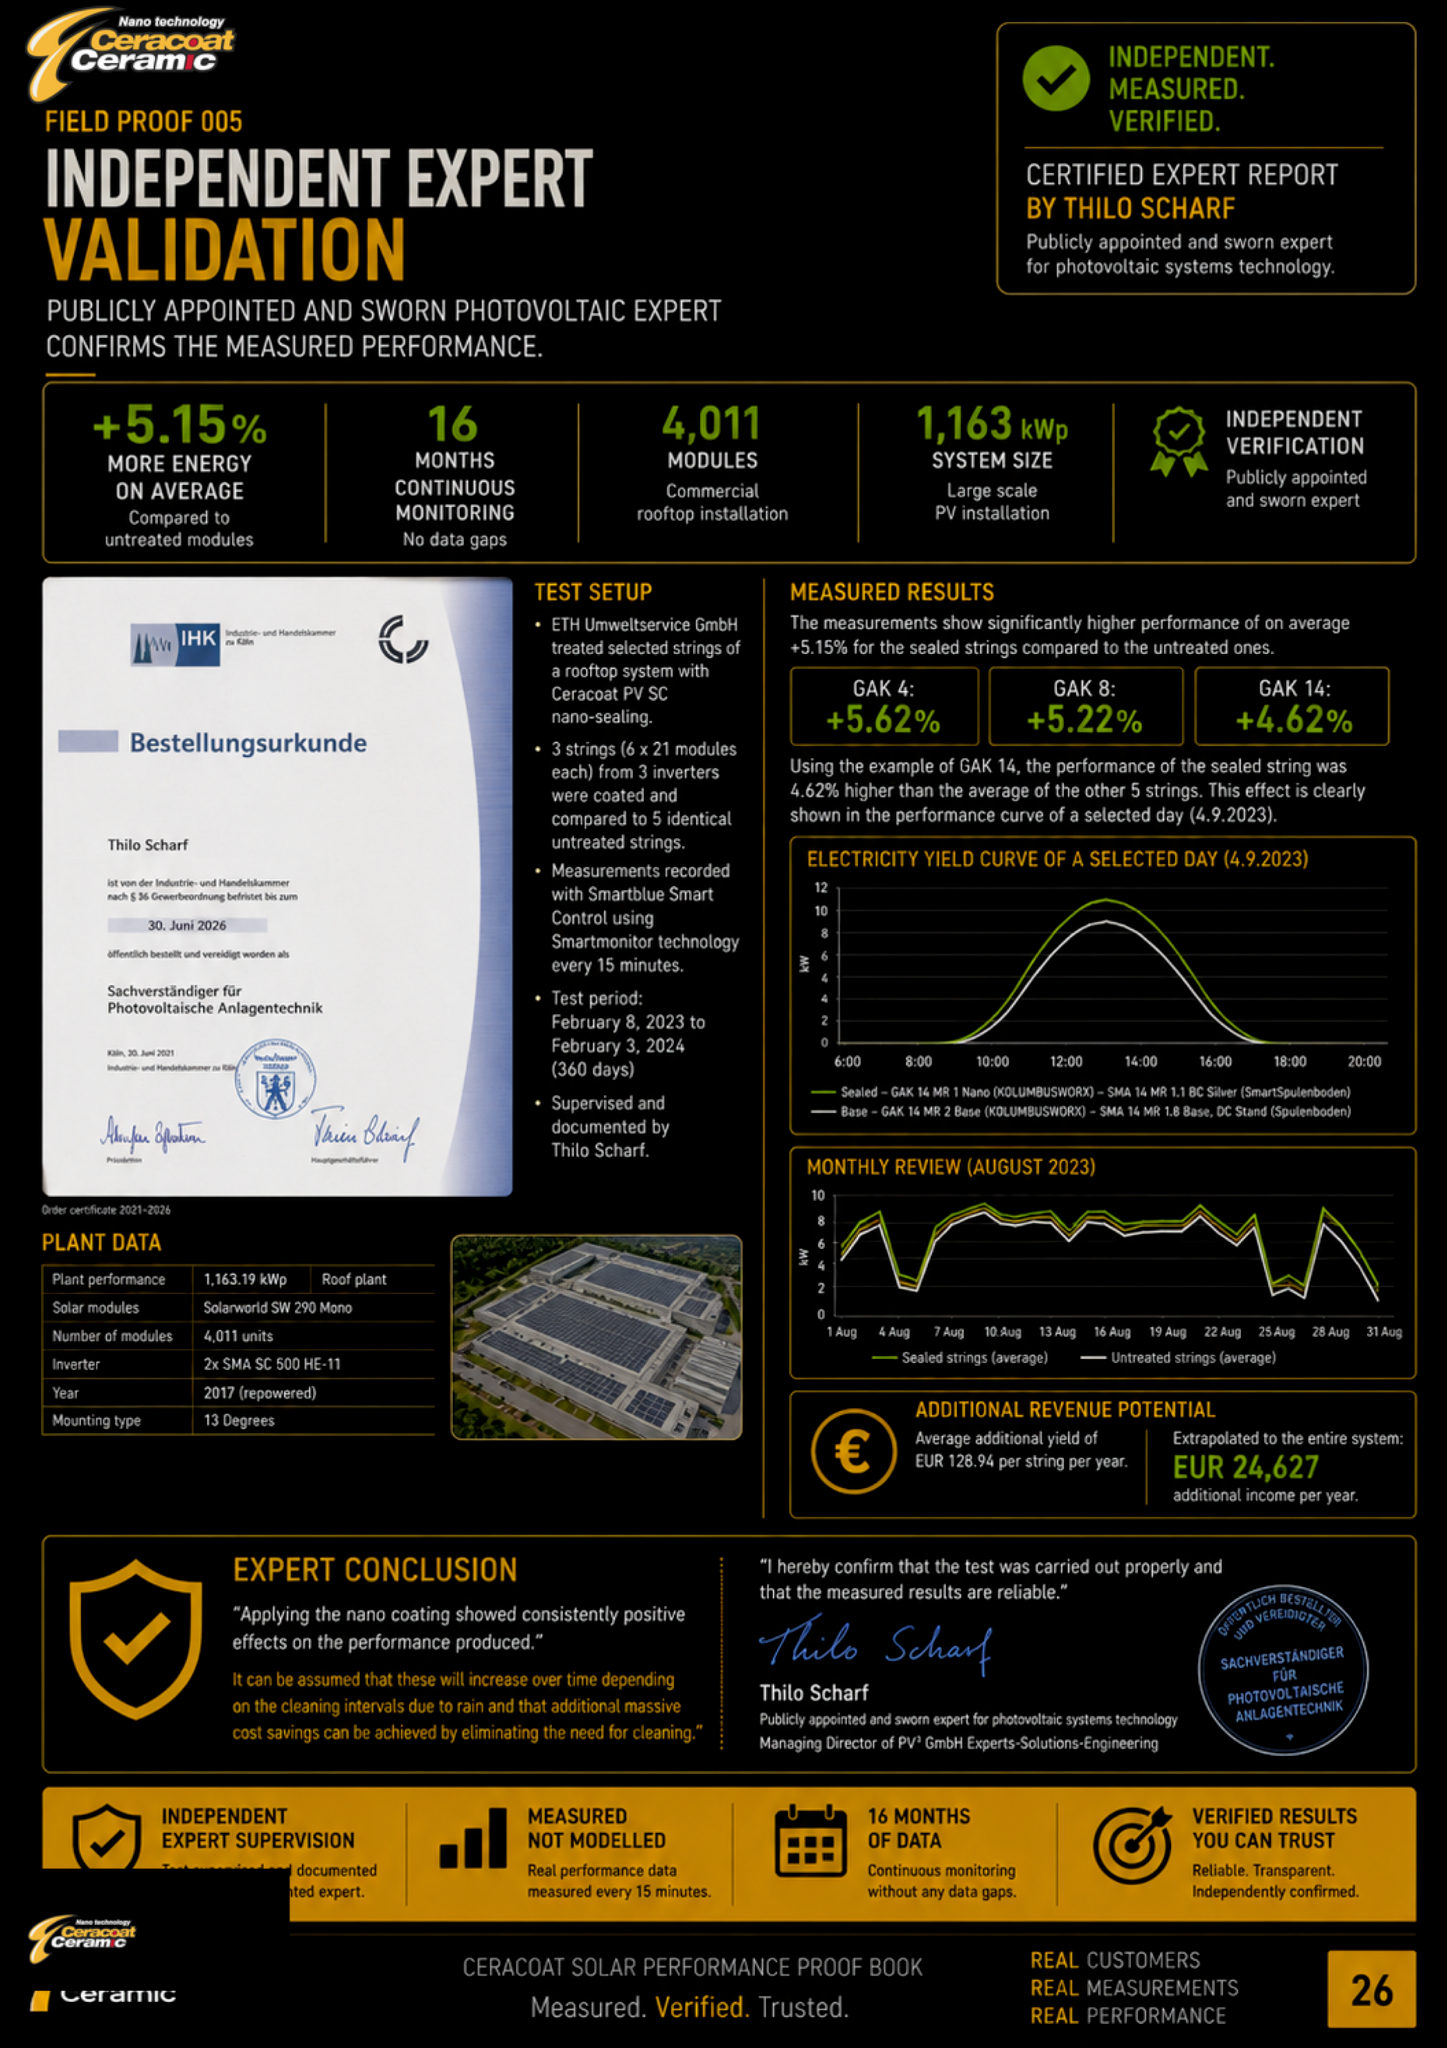
The supplied expert summary by Thilo Scharf reports an average 5.15% energy advantage for coated comparison strings, monitored at 15-minute intervals.
Read original evidence sheet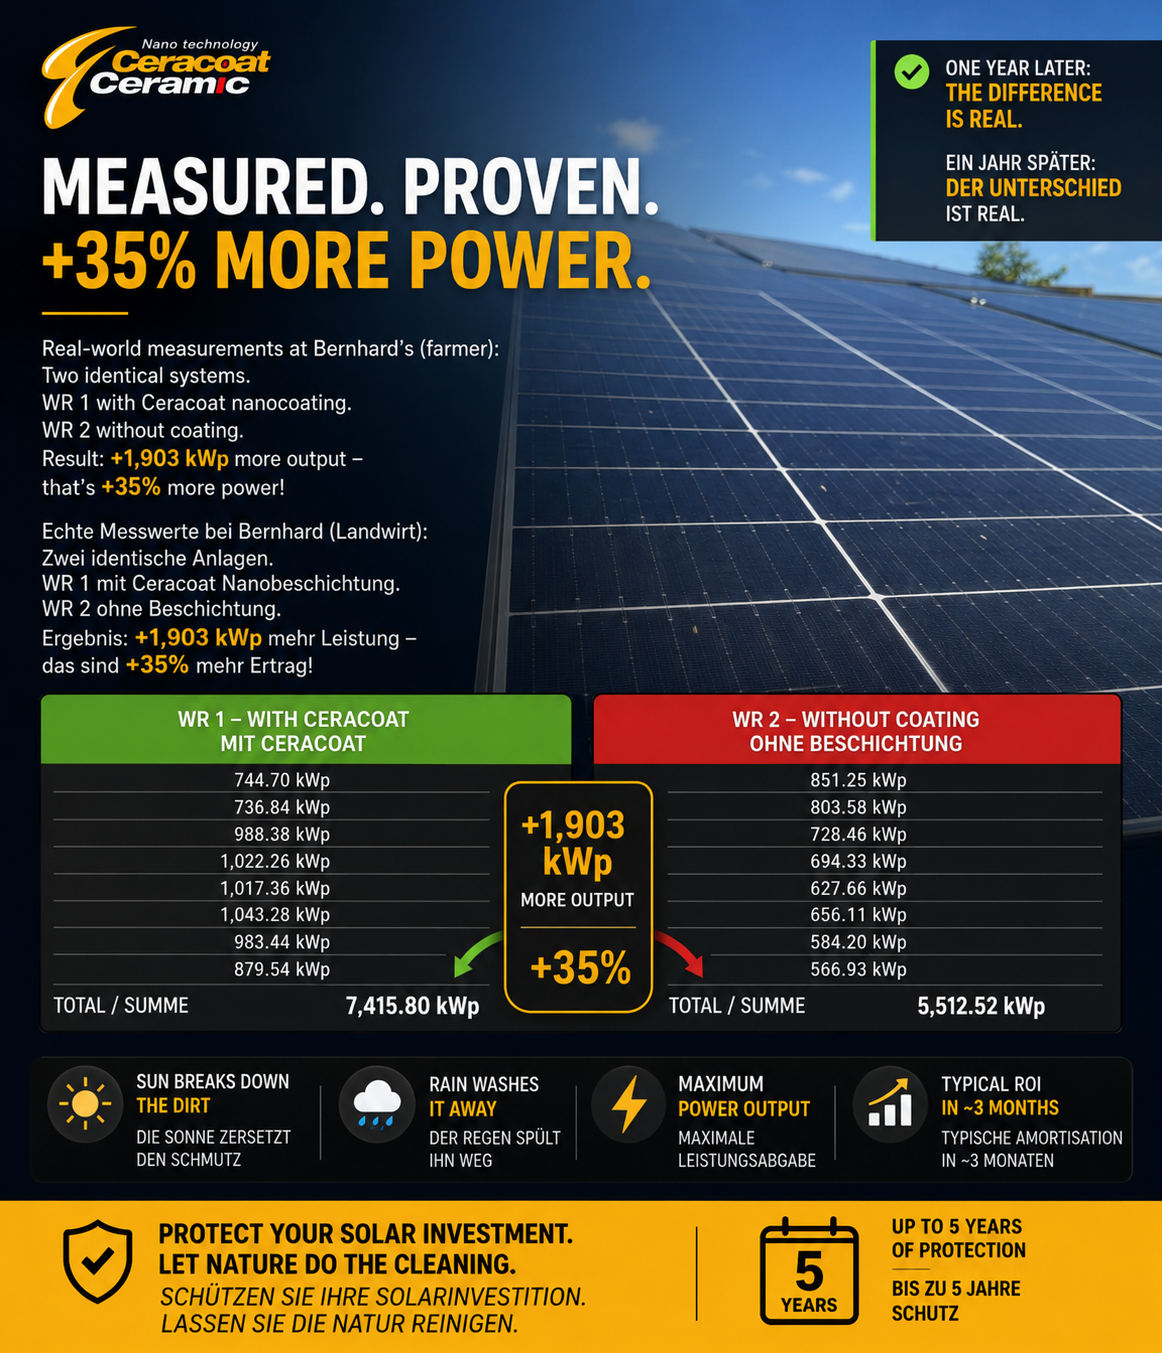
Reported production comparison between two systems, one coated and one uncoated.
Read original evidence sheet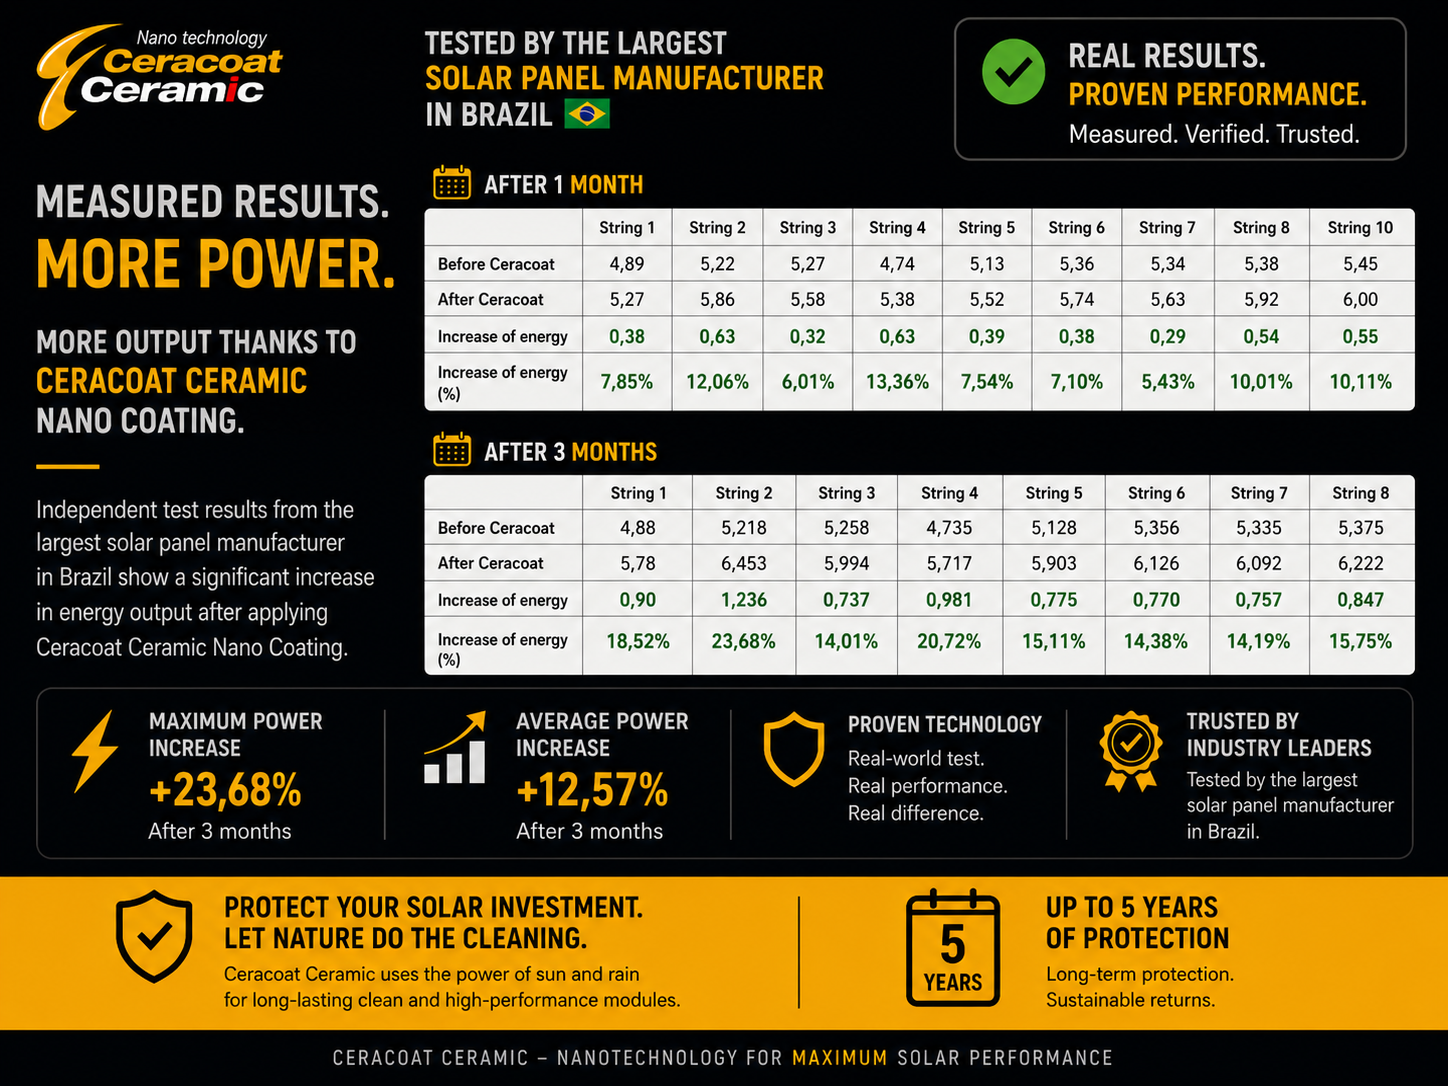
The supplied comparison lists before-and-after string measurements after 1 and 3 months, with a maximum reported increase of 23.68% after 3 months.
Read original evidence sheet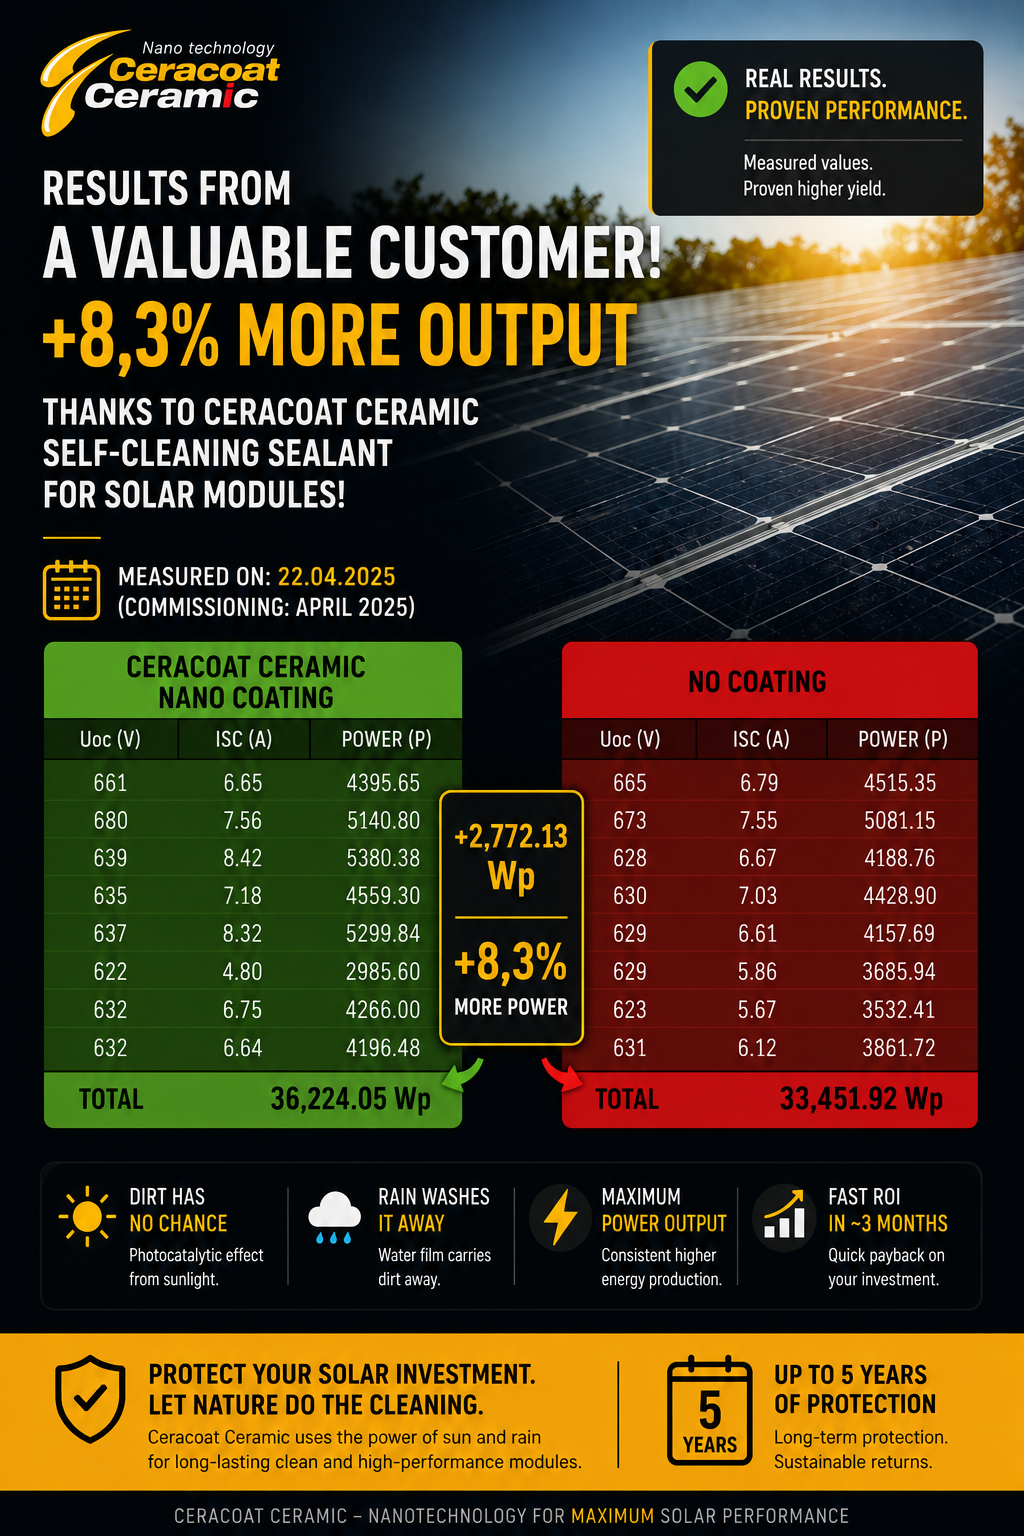
The sheet dated 22 April 2025 reports 8.3% higher measured power for the coated comparison. This is a power measurement, not an annual energy-yield figure.
Read original evidence sheet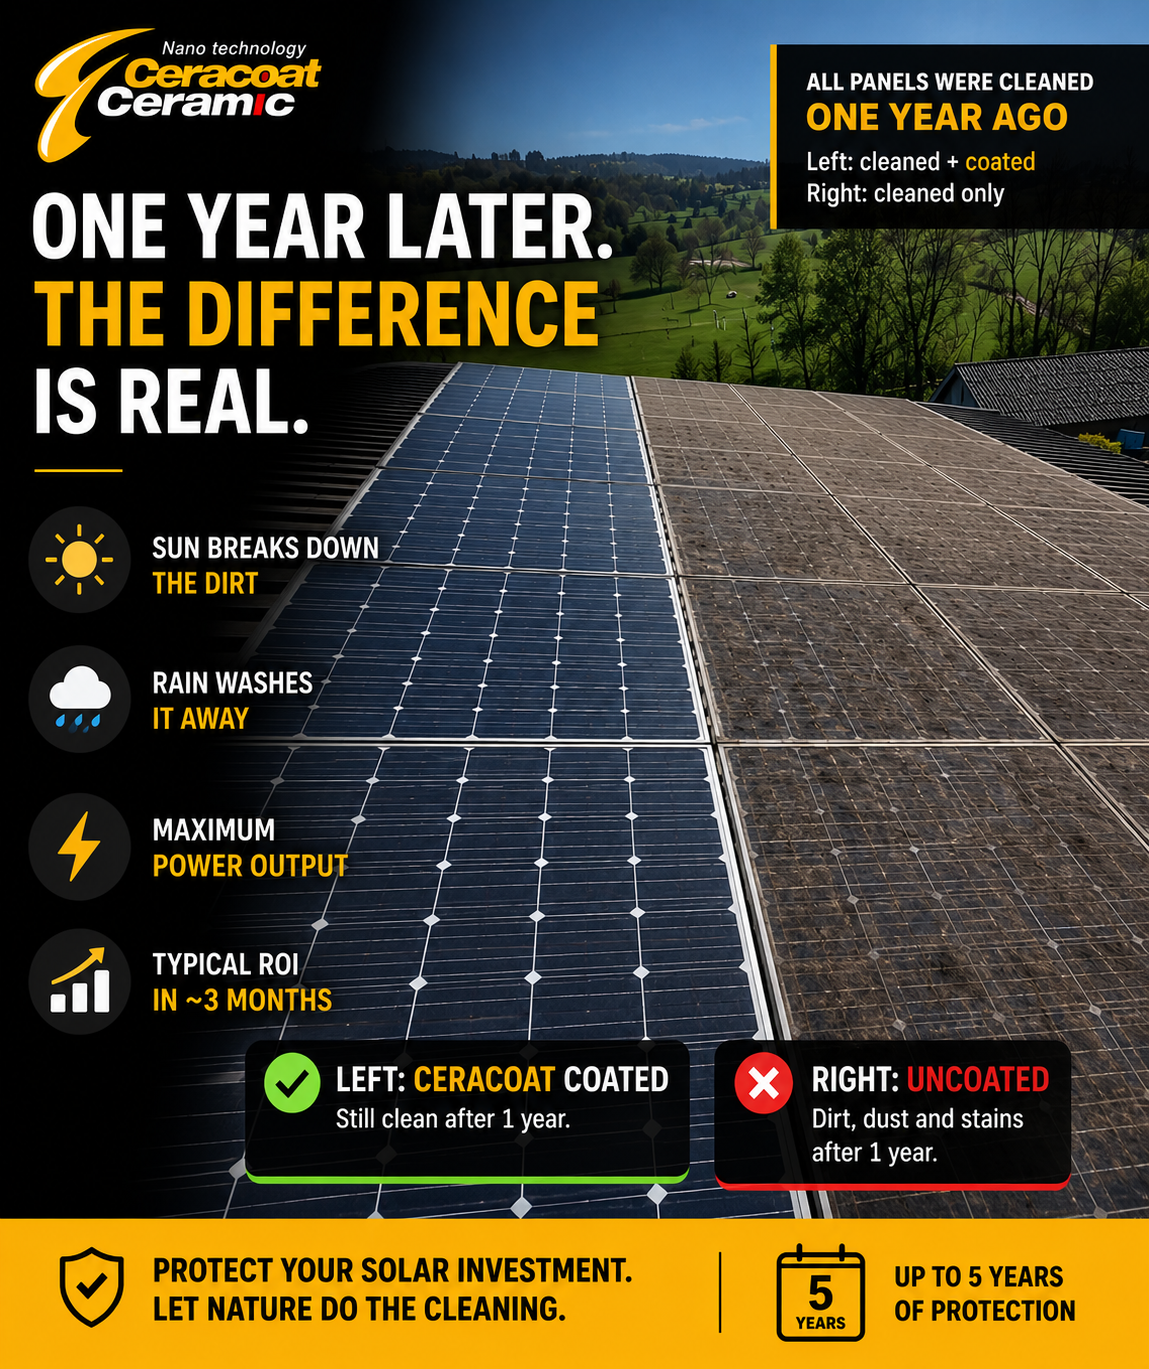
All modules were cleaned at the start. The sheet contrasts the coated side with the side that was cleaned only, one year later.
Read original evidence sheet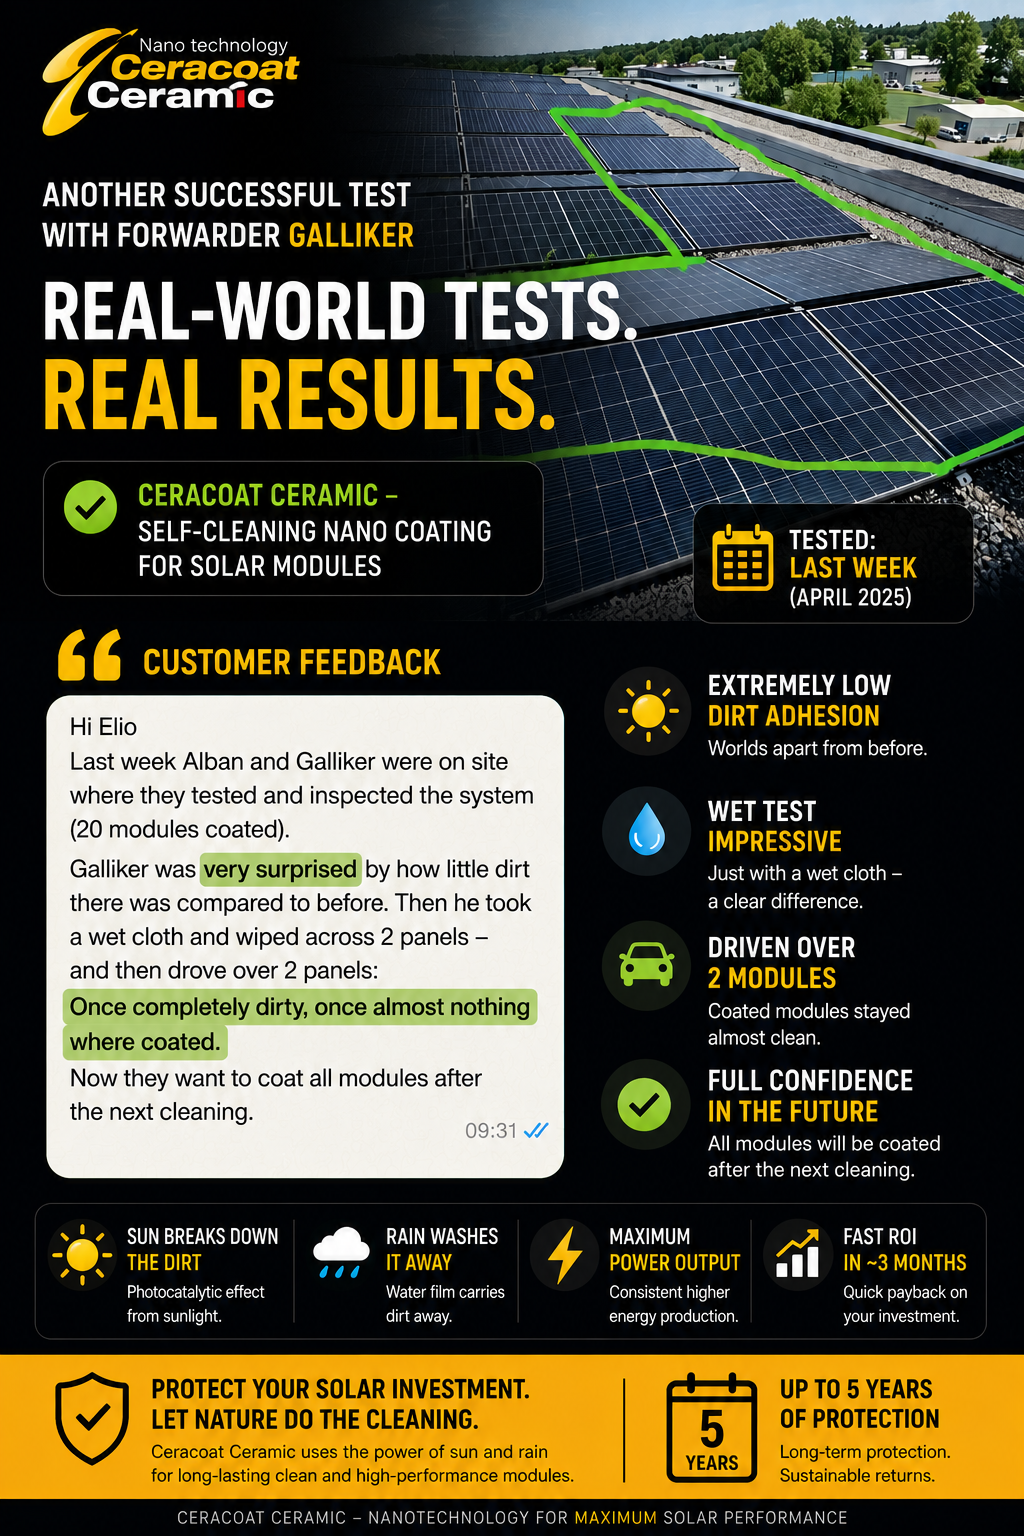
Customer feedback describes less dirt adhesion on 20 coated modules and an intention to coat further modules after cleaning.
Read original evidence sheet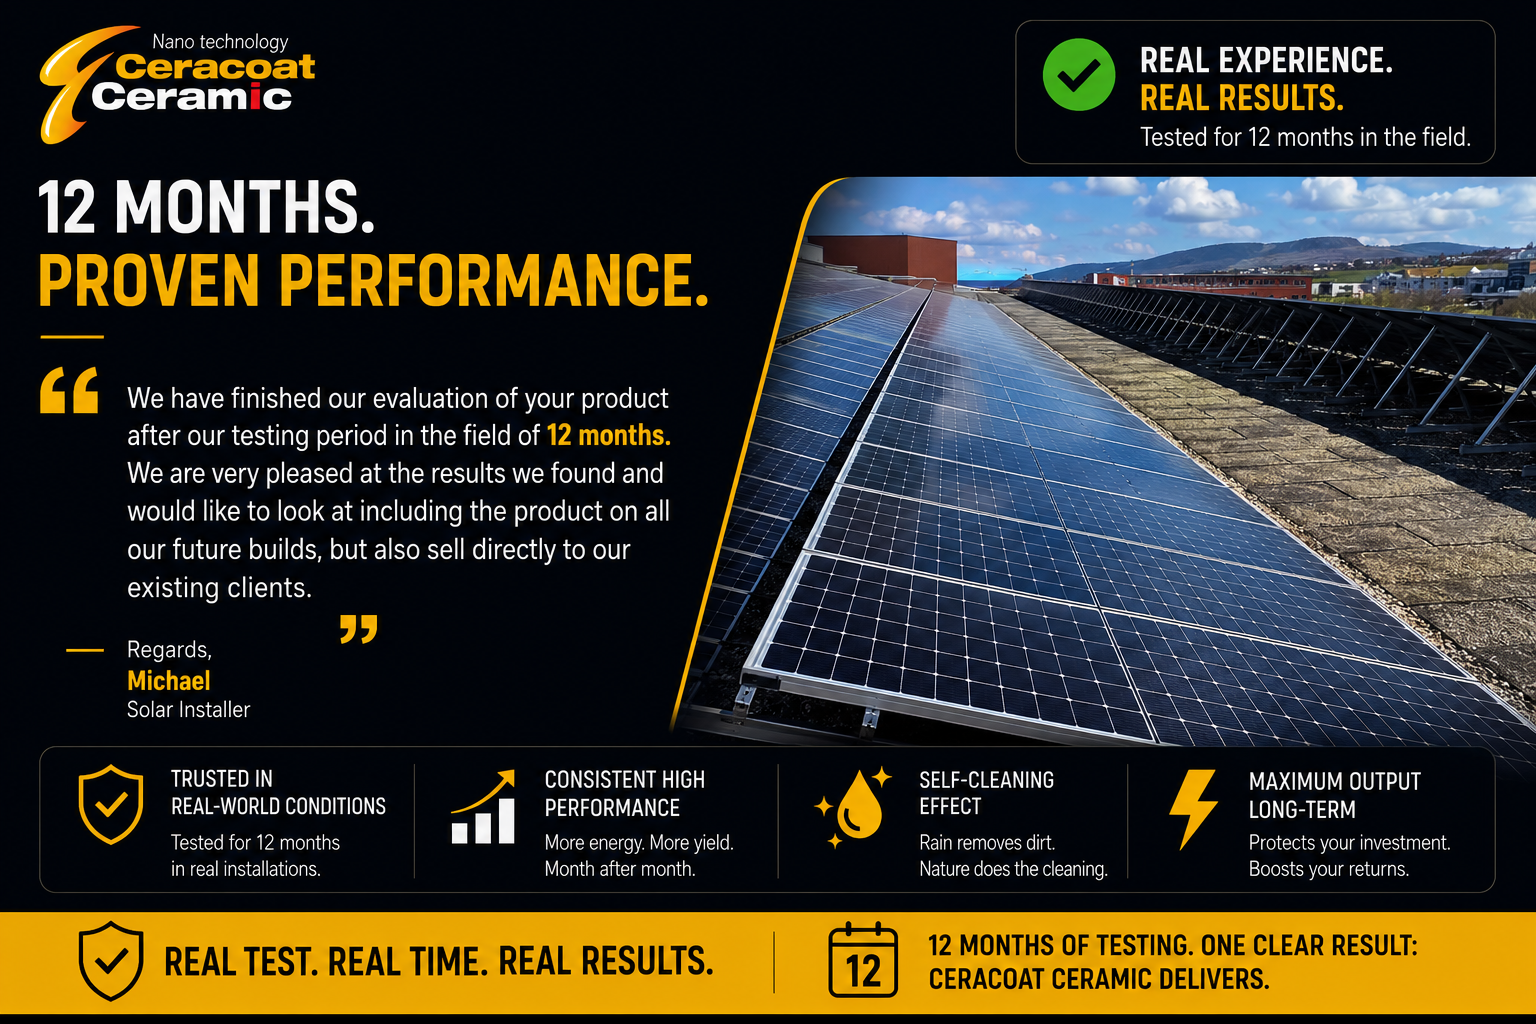
Installer Michael reports positive results after a 12-month field evaluation and interest in using the coating on future builds and existing customer systems.
Read original evidence sheet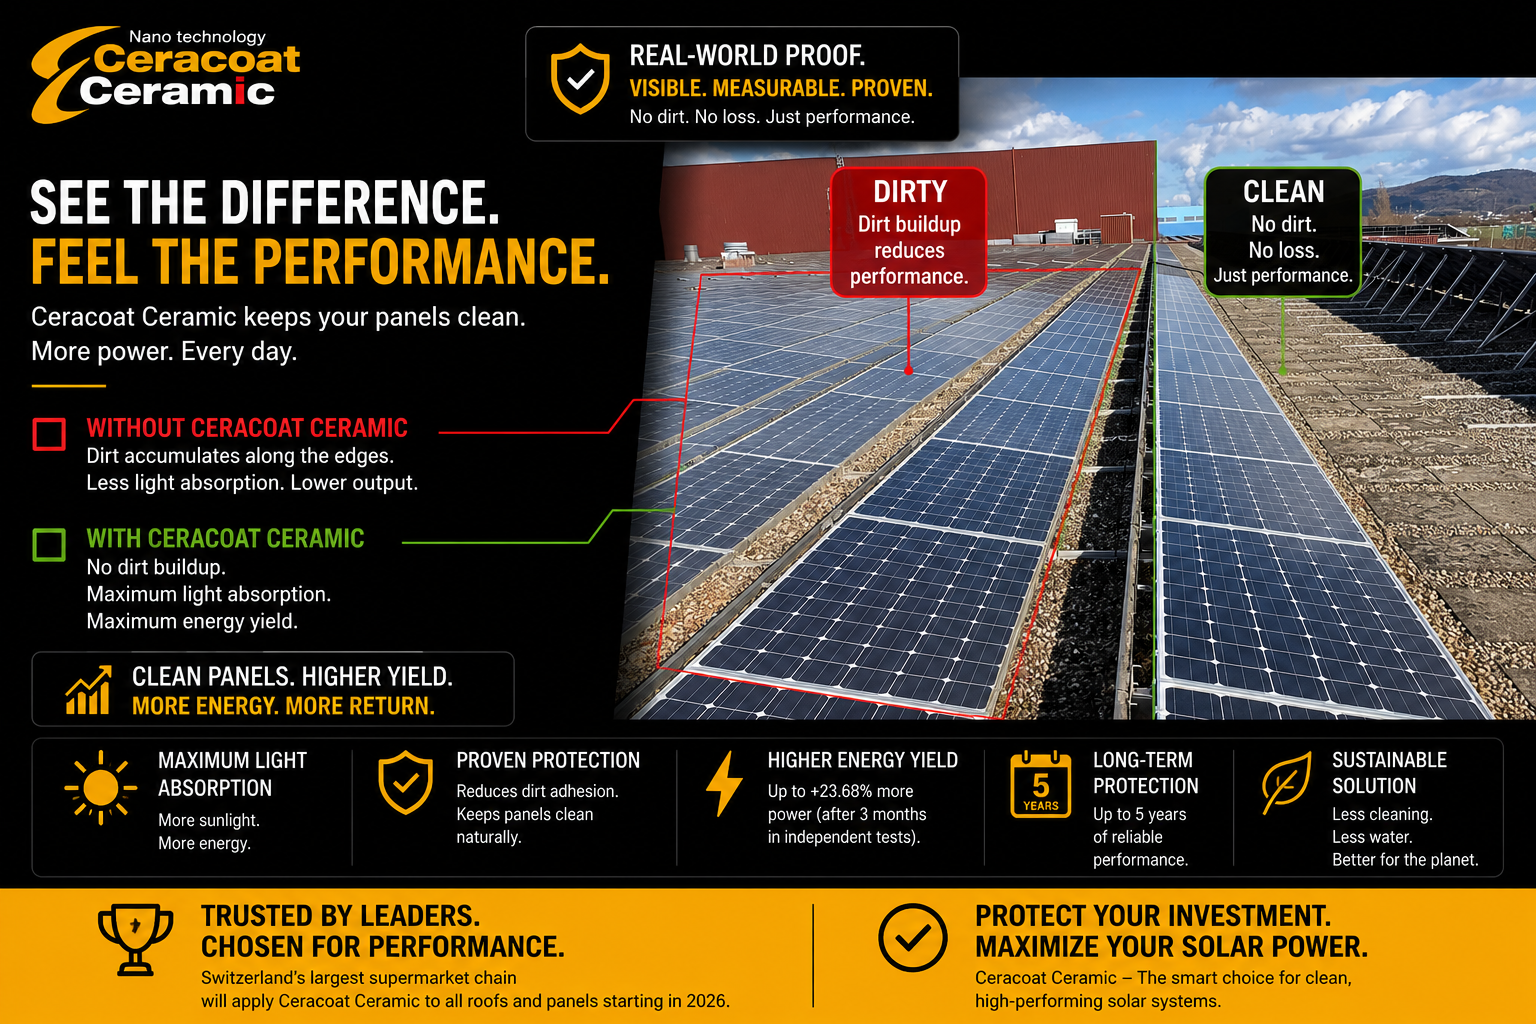
A rooftop comparison highlights deposits along uncoated module edges and the cleaner appearance of the coated section.
Read original evidence sheet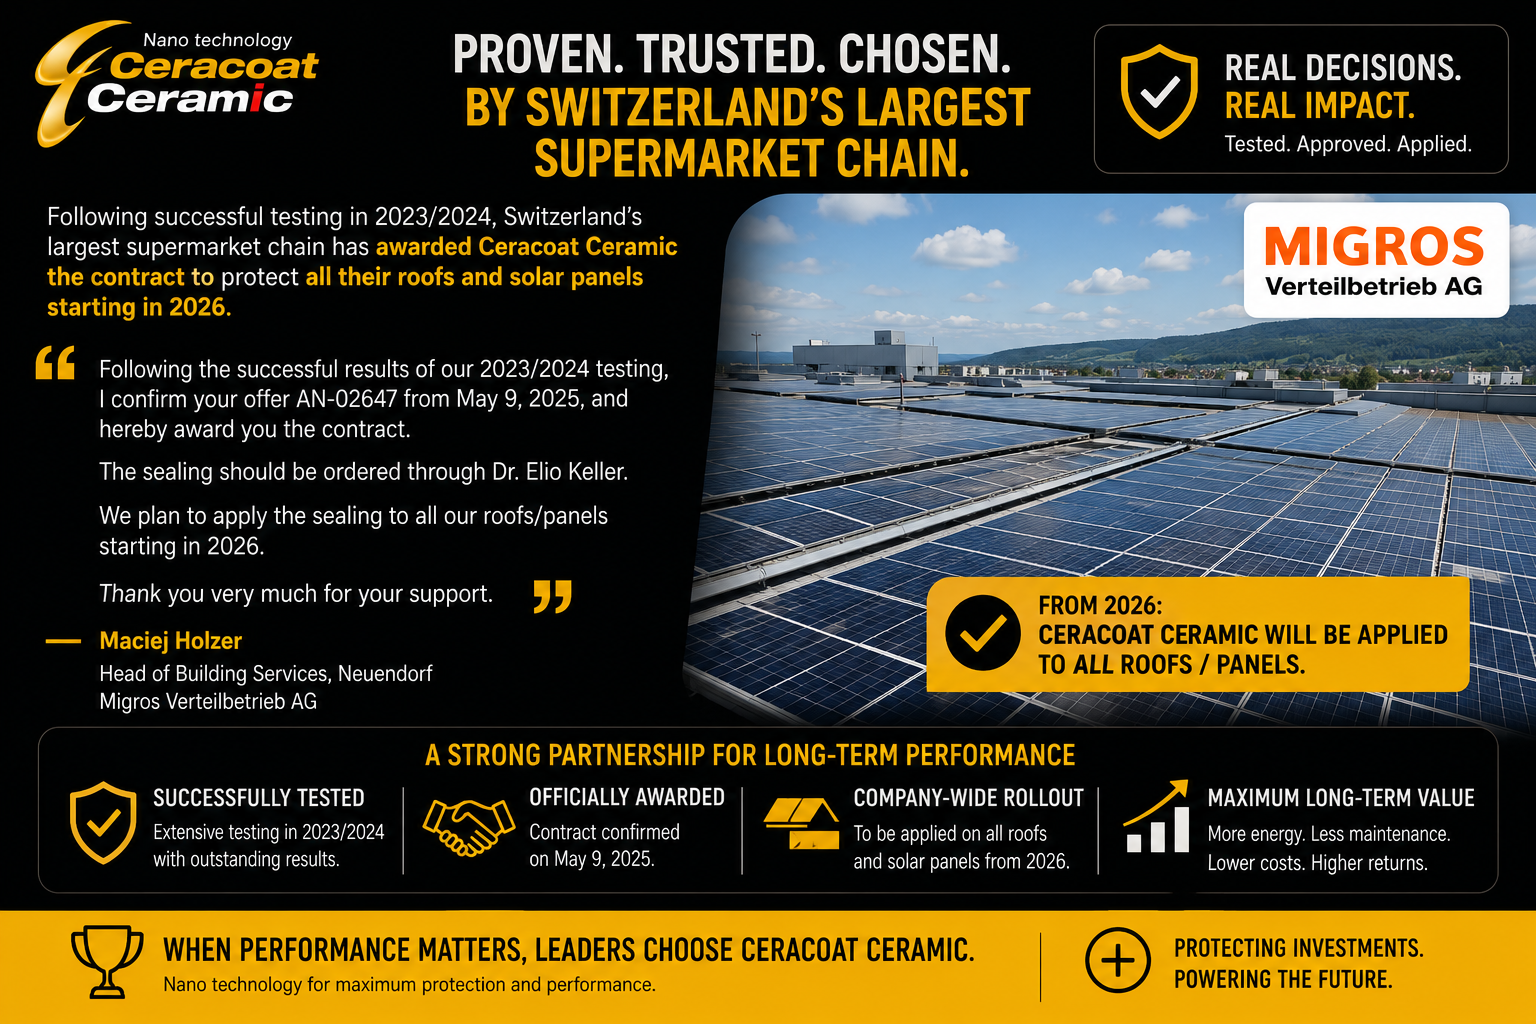
The supplied confirmation from Migros Verteilbetrieb AG describes successful 2023/2024 testing, a contract award and planned coating of roofs and panels from 2026.
Read original evidence sheet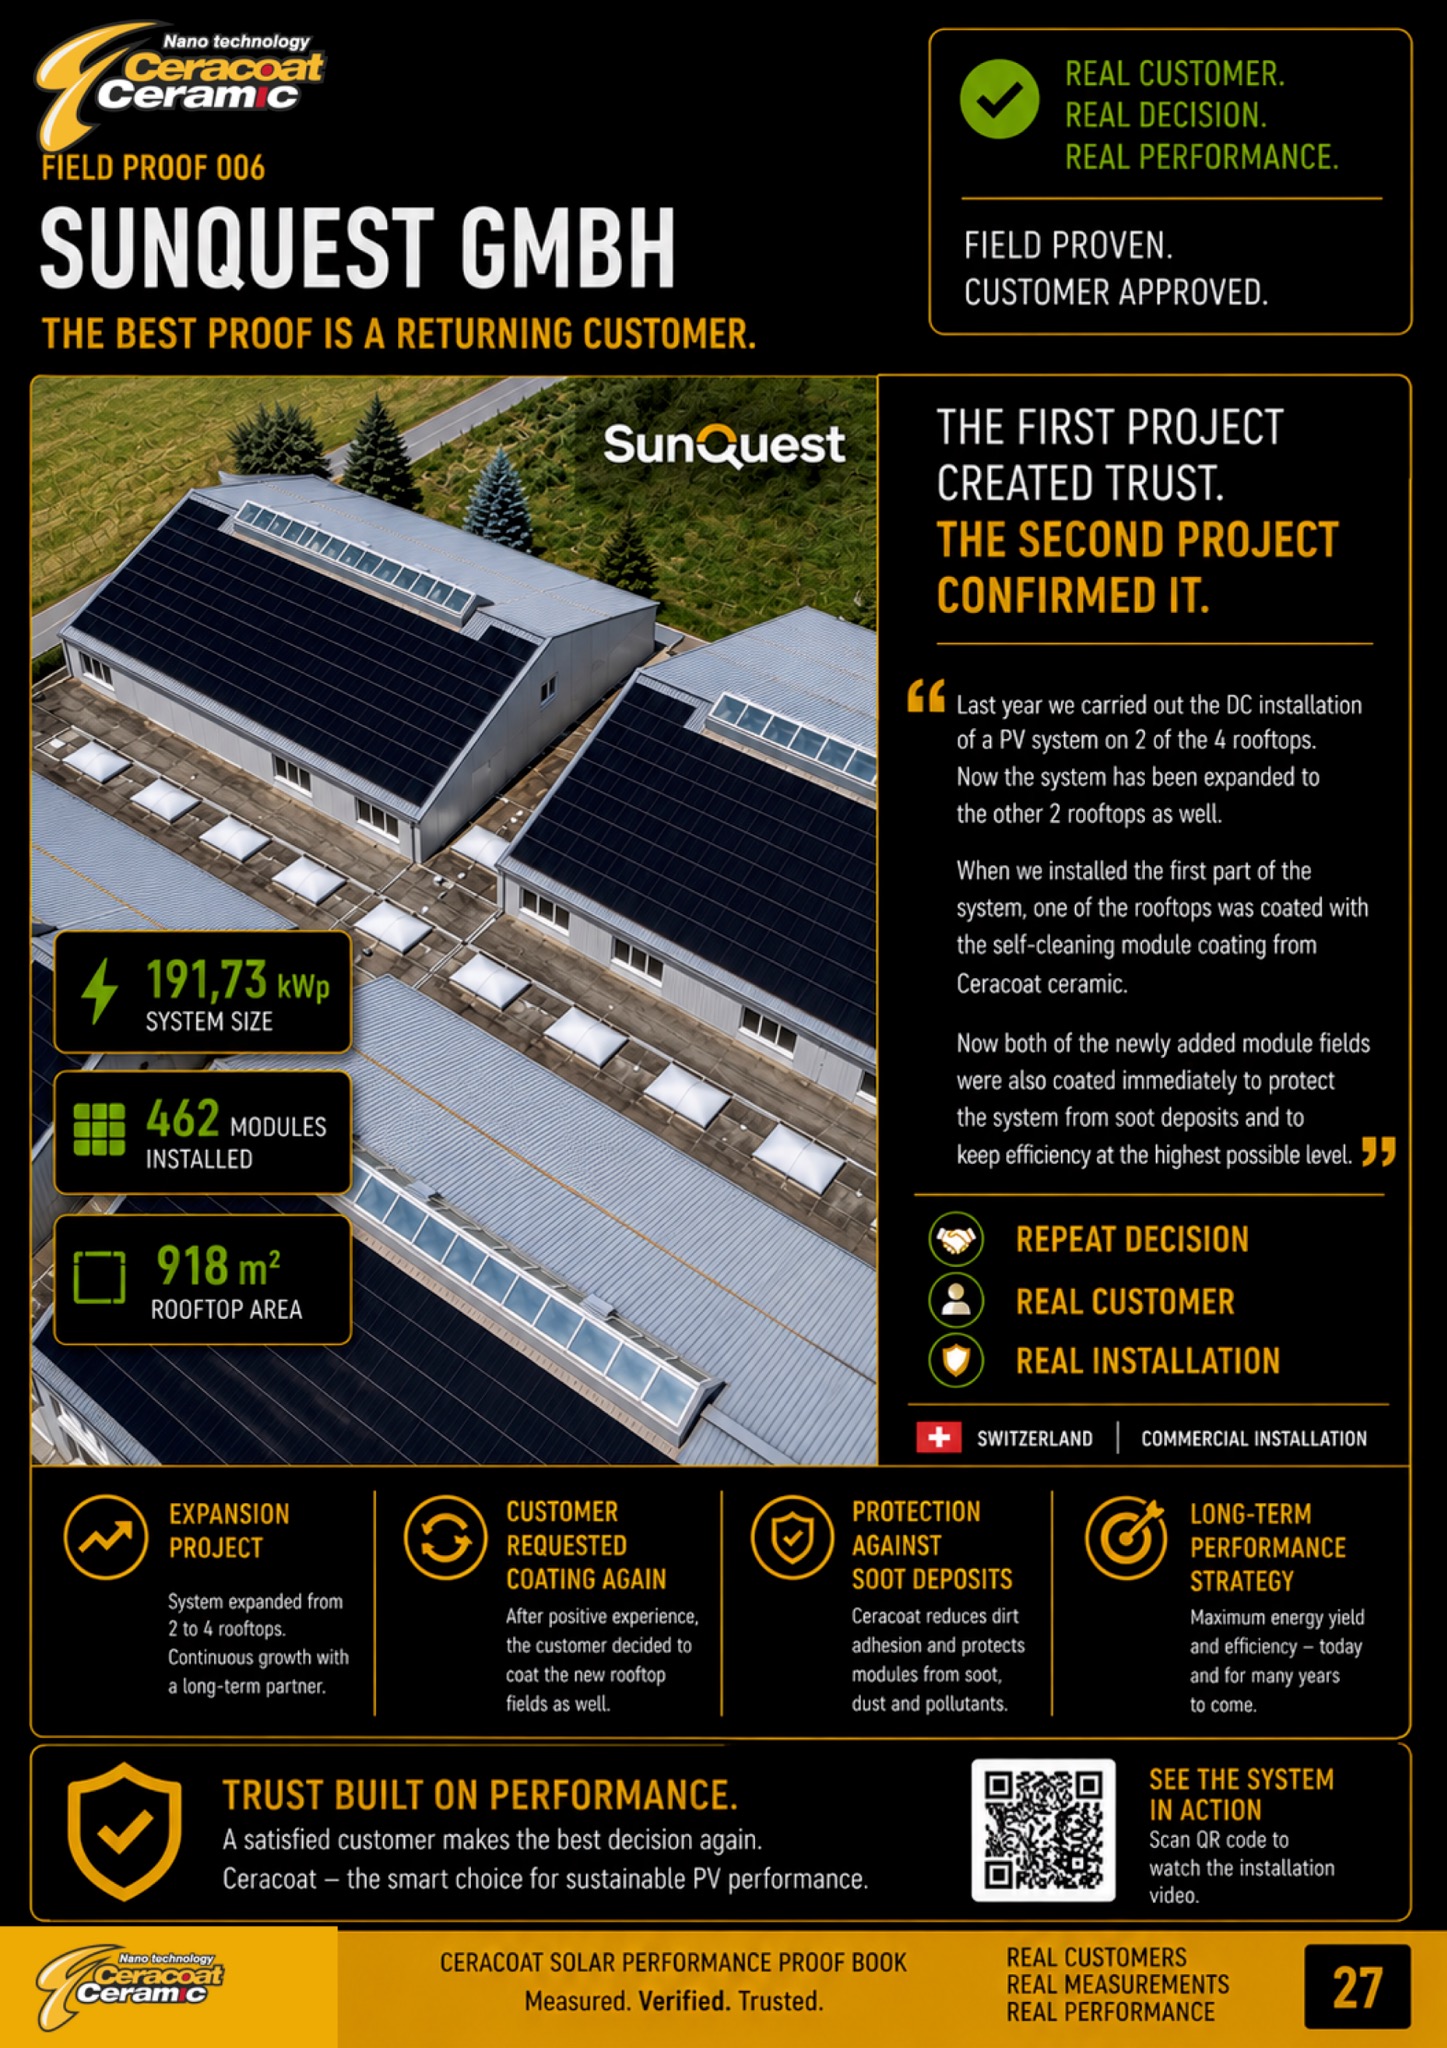
After the initial project, the customer chose coating again for two additional rooftop fields. The sheet describes a 191.73 kWp system with 462 modules.
Read original evidence sheet
Customer feedback from Grace describes including CERACOAT as a standard part of solar proposals and their cost calculation.
Read original evidence sheetA USEFUL PILOT
Select coated and uncoated sections with similar orientation, tilt, shading and operating conditions.
Clean both sections at the start. Record module details, coating date, weather and the measurement approach.
Follow production, rainfall and visible soiling over time. Keep regular photos and note maintenance events.
Photos can document surface condition. Production measurements answer a different question: how much energy did each comparable section produce over the same period?
For an informative pilot, account for irradiance, temperature, downtime and other differences between systems. CERACOAT can help discuss the trial scope and reporting approach.
Allow approximately two weeks for sunlight activation. The evaluation period should include representative soiling and rainfall conditions rather than relying on a single-day comparison.
Energy gains depend on the site and its existing soiling losses. A cleaner installation with little soiling may show a smaller benefit than a heavily affected site.
LET’S TALK SOLAR
Tell us about your installation, location and project goals.